Tutorials
Video tutorials can be found in our
 YouTube channel.
Additional cookbooks related to GigaMesh on the
Tools for Archaeology and Cuneiform Studies in the Modern Era – TACUME's gitlab page on
Open Educational Resources for 3D.
This is an application-based manual for the GigaMesh Software framework.
It shows basic processing steps typically and also very often used within our projects.
Many of the steps can be combined for more advanced tasks.
Theoretical concepts can be found in the publications section.
For earlier versions of the manual
click here.
Topics found in the manual:
- 00. Video Tutorials
- 01. First Steps
- 02. Labeling and Function Values
- 03. Mesh Cleaning
- 04. Profile Lines and Cross Sections
- 05. Unwrappings
- 06. Extrude Profile Lines
- 07. Distance Visualization
- 08. Distance Measurement between Points
- 09. Volume
- 10. Colorramps
- 11. MSII Filtering - Feature Vectors
- 12. Export Screenshots
- 13. Apply TPS RPM Transformation
02. Labeling and Function Values
Labeling is used to group parts of the mesh by selected properties. These can be unconnected parts of the mesh (see chapter Manual Mesh Cleaning) or the function value. This value is calculated for each vertex with the various functions GigaMesh offers such as distance functions and feature vectors. It is possible to select all vertices with the same function value or all vertices with a function value higher or lower than a set value. To view the function value of a vertex, hold ctrl and click on the mesh with the left mouse button. The FuncVal in the left side bar shows the function value of the set point. To copy it, press i. To select labeled areas, choose Select → Vertices - SelMVerts - by Value/Type → Vertices - Label No. Insert the label number(s) to select (e. g. 1 5 9) or leave unselected (e. g. -1). To select several labels at once, leave a space between the numbers.
Function values can be visualized with colorramps. Similar colors show a similar function value. See chapter *Colorramps to manipulate them.
Examples
Cut the Mesh by Function Value
Labeling can be used to cut a mesh with a plane (in general this also works with points, spheres or cones). Set the mesh plane where the cut should be made and choose Functions → Distance to Plane. All vertices on the plane have now the function value 0, this number increases as the distance to the plane becomes greater, on one side with positive, on the other side with negative numbers. Now click Select → Vertices - SelVerts - FuncVal </> to select vertices with a function value higher/lower than the value entered in the right box. In this example, enter 0. The vertices on one side of the plane are now selected and can be removed via Edit → Remove SelMVerts. Note that entering another value expands the selection. To start again, choose Select → Vertices - SelMVerts - Deselect All.
Label Areas by Function Value (Example: Cuneiform Tablet)
To label several areas of interest, compute the feature vectors (see chapter Feature Vectors) and open the new .ply-file with these vectors included. Choose Functions → Feature Vector Length (Man/1-Norm) or another feature vector visualization. It is recommended to use isolines now by choosing Colorramp → Isolines To adjust them, use Isolines - Distance and Isolines - Offset until only one is left on the border of the area of interest. These lines run along the surface and stay on vertices with the same function value. Select a point near the border of an area of interest by holding ctrl and clicking on it with the left mouse button. Activating View → Edges mand zooming in makes them easier to find. The function value is displayed in the left side bar. Then choose Select → Vertices - SelVerts - FuncVal </>. The function value should be pasted automaticly in the right field. Click OK and all vertices in the areas of interest are selected. If it is the other way around, choose Select → SelMVerts - Invert selection. Remove the green crosses on each vertex by clicking View → Vertices → Selected (SelMVerts).
To label the slected vertices, choose Labeling → Label SelVerts. In the right side bar, select Vertex Labels to display them. Each label number is displayed in one of ten colors.
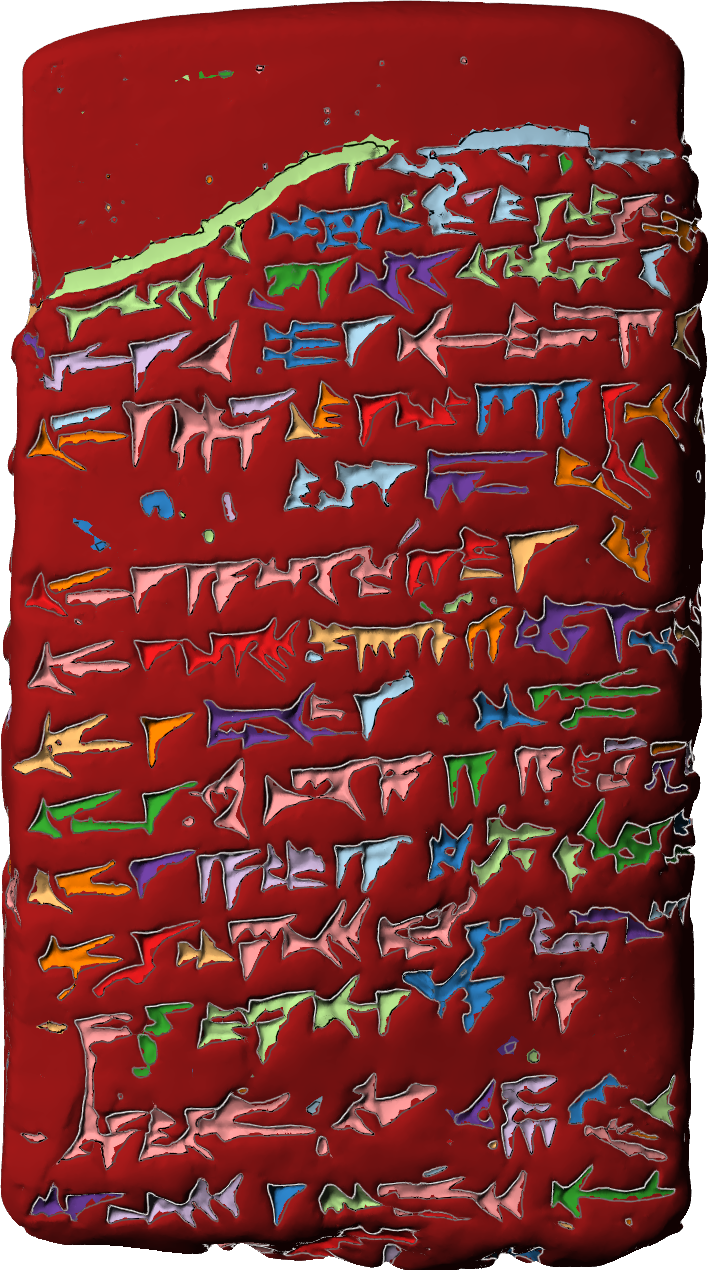
Figure 2:
Areas Labeled by Function Value